© 2020 Gwen Dewar, all rights reserved

Wish you knew the risk of contagion at local venues and events? This online tool — created by bioinformatics researchers — can help.
You want to grocery shopping. You’ll be one of approximately 50 shoppers inside the store. What’s the chance that at least one of these people will be COVID-19 positive?
It depends on the details, of course. Where is the grocery store? What’s the most current, local rate of infection? And then you need to crunch the numbers.
It’s the sort of task I’d like to delegate to the family droid. Except I don’t have a family droid.
So I’m happy to have discovered the next, best thing — the “COVID-19 Event Risk Assessment Planning Tool.” It helps translate vague perceptions of risk into concrete — and sobering — probabilities.
The tool was created by a group of researchers from the Georgia Institute of Technology, the Applied Bioinformatics Laboratory, and Stanford University. And it’s easy to use.
Navigate to this webpage at the Georgia Institute of Technology, and then locate your county on the map.
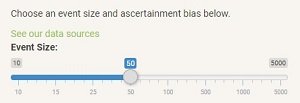
Then select the “event size” you wish to investigate — the number of people in the crowd.
For example, on November 20, 2020, I checked the risk level in Washtenaw county, Michigan.
According to the tool, there is a 62% chance that at least one person positive for COVID-19 would be present in a random grouping of 50 people.
The tool provides estimates for counties throughout the United States. It also covers counties and regions in the United Kingdom, France, Spain, Italy, Switzerland, Austria, and the Czech Republic.
How are the estimates calculated?
The tool gets official reports of COVID-19 cases for each county (updated daily). And the tool makes the default assumption that actual rates are 5 times higher than the official reports indicate. The researchers say this assumption is justified by data obtained from antibody testing.
And the purpose of the tool? The researchers want to “…help individuals and policy makers make prudent decisions (for example, increasing mask-wearing compliance and avoiding larger gatherings) that could help control the spread of SARS-CoV-2, particularly in hard-hit regions” (Chande et al 2020).
For more information, you can read the researchers’ peer-reviewed paper for the journal Nature:
Chande A, Lee S, Harris M, Nguyen Q, Beckett SJ, Hilley T, Andris C, and Wietz JS. 2020. Real-time, interactive website for US-county-level COVID-19 event risk assessment.Nat Hum Behav: https://doi.org/10.1038/s41562-020-01000-9.
Be safe!
Content last modified 11/20/2020
image of shoppers standing in line by Jennifer M. Mason / shutterstock